TDCC Laboratory
| HOME | JAPANESE |
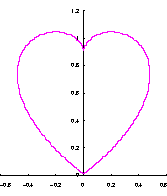
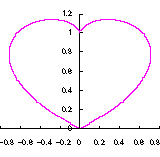
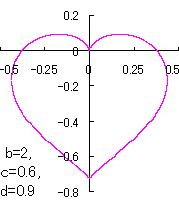
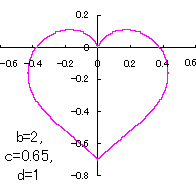
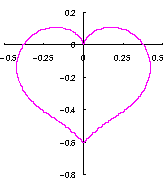
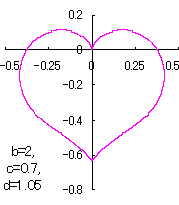
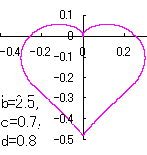
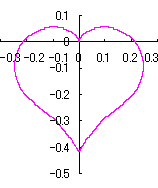
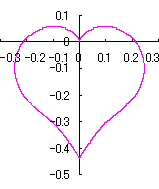
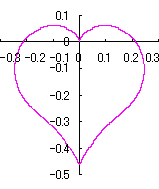
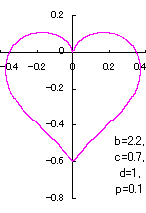
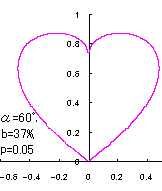
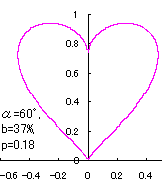
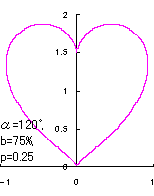
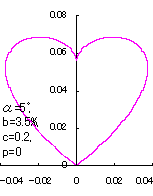
Heart Curve II
Nobuo YAMAMOTO
You can copy and use all the figures in this page freely.
|
1. Preface
Many types of heart curves are seen on the sites of Heart Curve - Mathematische Basteleien, First heart Curve - Wolfram|Alpha and Heart Curve -- from Wolfram MathWorld as representations.
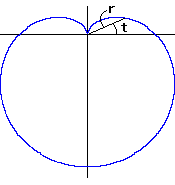
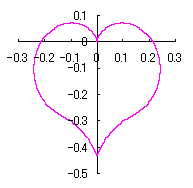
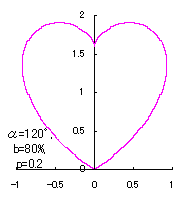
In this page, it is tried that a Cardioid is reformed into a heart curve.
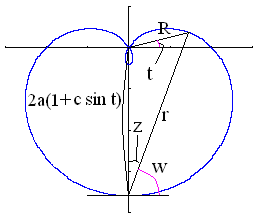
Though the Cardioid is introduced in the page of
Wolfram Math World,
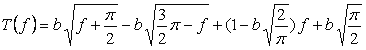
the equation expressing a Cardioid is rewritten as the following after the length and the width are replaced.
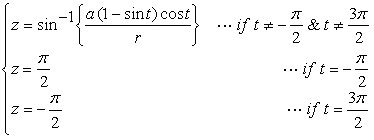 ,
(3) ,
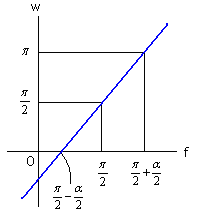
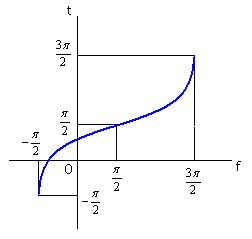
(3)where The newly defined phase angle where
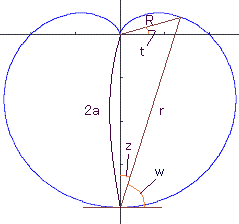
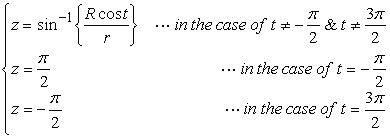
In the next, in order that the bottom of the Cardioid is reformed into a heart curve with a corner having the desired angle 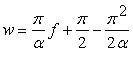 . (5) . (5)If we substitute Eq.(4) into Eq.(5), the conversion equation from The orthogonal coordinate expression of the heart curve may be written as the following two equations; where By calculating Eqs.(2), (3), (6), (7) and (8), the |
 |
 |
|
|
|
 |
 |
|
|
|
 |
 |
|
|
|
 |
 |
|
|
|
 |
 |
|
|
|
 |
 |
|
|
|
 |
 |
|
|
|


 , (9b)
 is the positive real number.
 |
 |
|
|
|
 |
|
from |
|
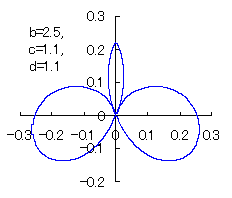
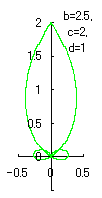
Moreover, in order to obtain beautiful shape of heart figure, both of the coefficient |
 |
 |
|
|
|
 |
 |
|
|
|
 |
 |
|
|
|
 |
 |
|
|
|
 |
 |
|
|
|
 |
 |
|
|
|
 |
 |
|
|
|
 |
 |
|
|
|
 |
 |
|
|
|
 |
 |
|
|
|
 |
 |
|
|
|
 |
 |
|
|
|
 |
 |
|
|
|
 |
 |
|
|
|
 |
 |
|
|
|
 |
 |
|
|
|
 |
 |
|
|
|
 |
 |
|
|
|
 |
 |
|
|
|
 |
 |
|
|
|
 |
 |
|
|
|
 |
 |
|
|
|
 |
 |
|
|
|
 |
 |
|
|
|
 |
 |
|
|
|
 |
 |
|
|
|
 |
 |
|
|
|
 |
 |
|
|
|
 |
 |
|
|
|
 |
 |
|
|
|
 |
 |
|
|
|
 |
 |
|
|
|
 |
 |
|
|
|
 |
 |
|
|
|
 |
 |
|
|
|
 |
 |
|
|
|
 |
 |
|
|
|
 |
 |
|
|
|
 |
 |
|
|
|
 |
 |
|
|
|
 |
 |
|
|
|
 |
|
|
|
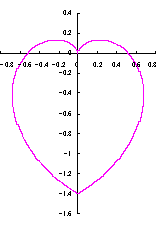
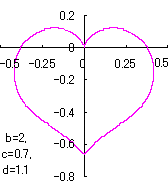
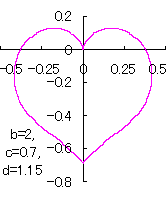
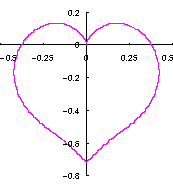
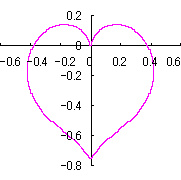
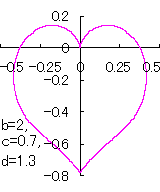
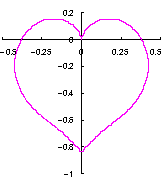
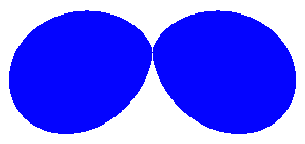
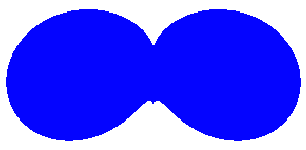
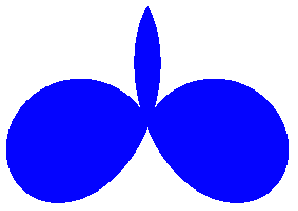
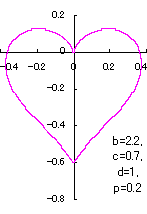
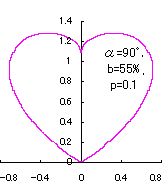
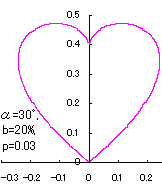
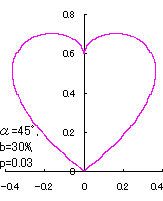
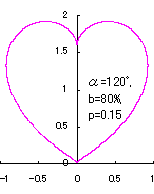
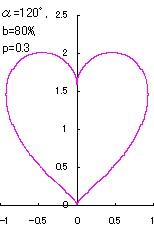
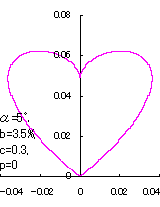
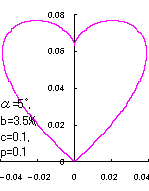
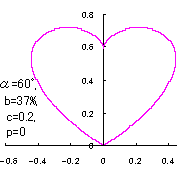
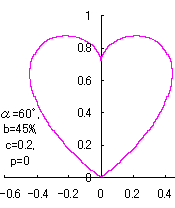
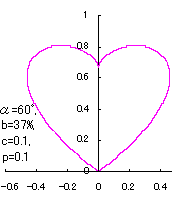
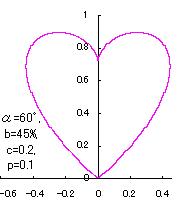
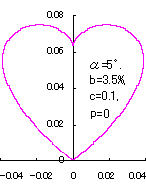
When the above figures are painted, these are shown in the followings.
                                                                                  
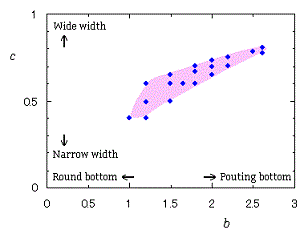
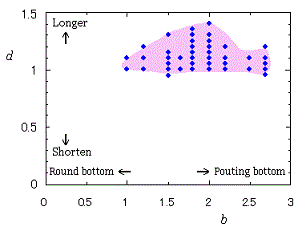
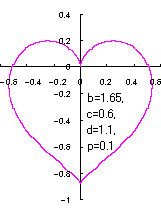
In another method, the better shaped heart curves are obtained and shown in |
|
||
|
||
|
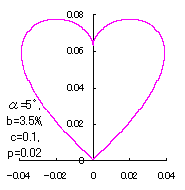
in which a heart curve may be found Herein, pink colored area represents its region, and blue colored dots represents data points which are obtained when heart curves are displayed as above. |
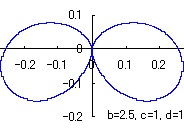
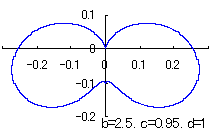
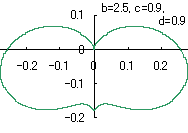
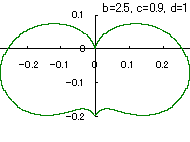
The other types of curves besides the heart shaped ones are also obtained as follows. |
 |
 |
|
|
|
 |
 |
|
|
|
 |
 |
|
|
|
|
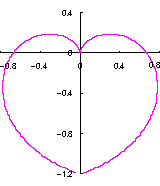
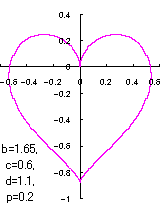
When the above figures are painted, these are shown in the followings.
4. Method 3
We try to make the dent of a heart figure by the method 2 deeper and wider. To do this, Eq.(10b) is changed to the following equation besides Eq.(10a) remains unchanged.
|


 |
 |
|
|
|
 |
 |
|
|
|
 |
 |
|
|
|
 |
 |
|
|
|
 |
 |
|
|
|
 |
 |
|
|
|
 |
 |
|
|
|
 |
 |
|
|
|
 |
 |
|
|
|
 |
 |
|
|
|
 |
 |
|
|
|
|
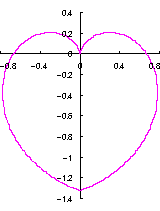
When the above figures are painted, these are shown in the followings.
5. Method 4
According to the concept as like as mentioned in the previous method 3 again, Eq.(10b) is changed to the following equation besides Eq.(10a) remains unchanged. |


 |
 |
|
|
|
 |
 |
|
|
|
 |
 |
|
|
|
 |
 |
|
|
|
 |
 |
|
|
|
 |
 |
|
|
|
 |
 |
|
|
|
 |
 |
|
|
|
 |
 |
|
|
|
 |
 |
|
|
|
|
When the above figures are painted, these are shown in the followings.
6. Method 5
We try to make the dent of a heart figure by the method 1 deeper and wider. To do this, Eq.(8) is changed to the following equation besides Eq.(7) remains unchanged. |


 |
 |
|
|
|
 |
 |
|
|
|
 |
 |
|
|
|
 |
|
|
|
When the above figures are painted, these are shown in the followings.
According to the concept as like as mentioned in the previous method 5 again, Eq.(8) is changed to the following equation besides Eq.(7) remains unchanged. |


 |
 |
|
|
|
 |
 |
|
|
|
 |
 |
|
|
|
 |
 |
|
|
|
 |
 |
|
|
|
|
When the above figures are painted, these are shown in the followings.
8. Method 7
We try to apply the concept of the reformation of heart curve with the introduction of the coefficient |


 . (18)
 |
 |
|
|
|
 |
 |
|
|
|
 |
 |
|
|
|
 |
 |
|
|
|
|
When the above figures are painted, these are shown in the followings.
9. Method 8
We try to apply the concept of the reformation of heart curve with the introduction of the coefficient |


 |
 |
|
|
|
 |
 |
|
|
|
 |
 |
|
|
|
 |
 |
|
|
|
|
When the above figures are painted, these are shown in the followings.
|


_ returning to the page which opened just before with 'return' of browser _
or
_ returning to the HOME with the following button _
| HOME |