TDCC Laboratory

  HOME JAPANESE                                        

Measurement of Anisotropy of Electron Temperature in Magnetized Plasma by Magnetic Mirror Probe Method

Nobuo YAMAMOTO

1.   Introduction

       Magnetic mirror probe method    (   the same to the left   ) has been developed as the diagnostic tool for the measurement of anisotropy of electron temperature or anisotropy of distribution function of electron velocity in magnetized plasma by N. Yamamoto under Prof. Y. Hatta in Tohoku University since 1967.     This method can be applied in the middle range of externally applied magnetic field strength, in the middle range of plasma density and in the range of low electron temperature.   Another method may not exist in such ranges even in the recent time.


2.   Principle of the magnetic mirror probe method


Fig.1 Local magnetic mirror field


    The principle of this method is described below.   The local magnetic mirror field is formed in the front of the collecting surface Sp of the ordinary Langmuir probe as shown in Fig.1.     Then, the probe electron current may vary with the conservation law of magnetic momentum of electron, and the variation of this current may bring the information of anisotropy of electron temperature or anisotropy of distribution function of electron velocity in magnetized plasma.
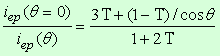
    We assume that the scale of the collecting surface of the probe is much larger than the electron cyclotron radius (the Larmoir radius), and is much smaller than the scale of the magnetized plasma.

    In Fig.1, the conservation law of magnetic momentum of electron is described as
      ,                      (1)
where and are the electron mass and the perpendicular component of the electron velocity to the magnetic field respectively.
   The conservation law of energy of election is described as
      ,                      (2)
where indicates the parallel component of the electron velocity to the magnetic field, and indicates the probe bias voltage which is assumed as
       .                      (3)
   From Eqs.(1) and (2), we obtain
      .                      (4)
   As the condition that an electron enters into the collecting surface Sp is ,we may write from Eq.(4) as the following;
       .                      (5)
    The above equation gives the lower limit of integral when an integration is performed in regard to in the after.
    If we take and as the respective element of areas and , we can write that
      ,                      (6)
by the conservation law of magnetic flux.
    If we take as the electron current flowing through the area , we can write this current with the use of the condition given by Eq.(5) as
       ,                      (7)
where
      .                      (8)
In the above equation, indicates the plasma density and is indicates the distribution function of electron velocity defined in the velocity space and is normalized as
       ,                      (9)
where is the density of state in the velocity space .
   Substituting Eq.(6) into Eq.(7) and integrating by dSp over all the area Sp, we obtain
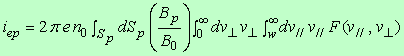
       .                      (10)
   The above obtained equation is the base equation giving the electron current entered into the mirror probe.

    When the distribution function of electron velocity is followed by bi-Maxwellian which has the parallel and the perpendicular electron temperatures and respectively to the magnetic field, we may describe as
       ,                      (11)
where
       ,                      (12)
and
       .                      (13)


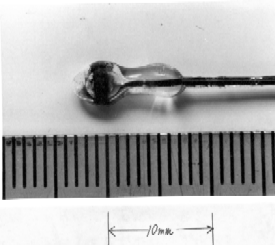
3.   Embodiment of this method

    As to realize the embodiment of this method, the most simple way is to apply a small ferromagnetic sphere to a probe body in the magnetized plasma.   Only a spot on the sphere is used the collecting surface of electrons, and the other part is shielded electrically,   It is needed that the scale of the spot is smaller than the Lamoir radius, and that the radius of this sphere is smaller than the scale of the magnetized plasma.


Fig.2 An illustration of the magnetic mirror probe
and an example of its measured data [reference (2)]

Fig.3 The actual magnetic mirror probe made
of steel sphere [reference (4)]


Fig.4 Magnetic field surrounding the spherical mirror probe


    Magnetic field strength on the spot can be varied from the equality to three times of the externally applied magnetic field strength as the angle between the externally applied magnetic field line and the orthogonal direction of the spot surface can be varied from 70 degrees of angle to zero.   Therefore, the local magnetic mirror ratio can be varied from one to three.   The magnetic field lines surrounding the ferromagnetic sphere are shown in Fig.4.
    Formation of the local magnetic mirror field or the rate of disturbance of the magnetic field from the uniformity caused by inserting the sphere of the mirror probe into the uniform magnetic field is described as
       .                      (14)
where .
    Accordingly,
       ,                      (15)
    The magnetic field lines are described as
       ,                      (16)
where is the constant accompanied with the each magnetic field line.
    At the surface of the mirror probe, the magnetic field strength is expressed as
       .                      (17)
    As the mirror probe must be used in the range of , must be in the range that
       .                      (18)

    Substituting Eq.(17) into Eq.(10), we obtain the electron current of the mirror probe as
       ,                      (19)
where
       .                      (20)

    If we substitute Eqs.(11), (12) and (13) into Eq.(19) and calculate the latter under the assumption that the distribution function of electron velocity takes bi-Maxwellian, we obtain the probe electron current depending on the spot angle as
       .                      (21)
    From the above equation,
      ,                      (22)
where
       .                      (23)

    When the electron temperature has isotropy, the electron current entered into the spot surface remains constant with no relation to the angle under the constant probe bias voltage.   On the other hand, if the electron temperature has anisotropy such as the perpendicular temperature to the externally applied magnetic field is larger than the parallel one, the electron current decreases when the angle takes small in accordance with the magnetic mirror effect decided by the local magnetic mirror ratio on the spot.   By measuring such phenomena, the anisotropy of the electron temperature or the anisotropy of the distribution function of the electron velocity may be determined.

    When we go back and see Fig.2 once again (in which the horizontal and the vertical axes represent the probe vias voltage and the electron current to the probe respectively and the angle is selected in four kinds of values as a parameter), the plotted data lie in the same gradient in every .   It suggests that the distribution function of the electron velocity takes the Maxwellian.

    As seen in Fig.1, the smaller the angle is, the larger the electron current is under a constant probe bias voltage.   This fact may be explained as the electron temperature has anisotropy such as the parallel temperature to the magnetic field is larger than the perpendicular one.   However, in reality, some macroscopic velocity of electrons parallel to the magnetic field causes to be seemed as an apparent existence of such anisotropy.   So, the analysis of the data obtained by the mirror probe must be taken care of such an existence of parallel macroscopic velocity of electrons.

    An example of the actual probe is shown in Fig.2.   The ferromagnetic sphere of this probe is made of the ordinary steel, and is covered by glass except for the spot surface.   The electrical lead-line is made of molybdenum wire which is attached well to shielding glass.


4.    Measurement examples of anisotropy of electron temperature or anisotropy of distribution function of electron velocity by the magnetic mirror probe method

4.1   Stationary plasma

    The measurements of anisotropy of electron temperature have been performed in four species of devices with the use of the mirror probe as below.   Although a little data show anisotropy of electron temperature,Most data indicate as the electron current of the mirror probe does not depend on the spot angle .   Thus, stationary plasma is judged not to have anisotropy of electron temperature contrary to our expectation.
   A little more detail in each device is described below.

4.1.1   TPC devices (the former Plasma Laboratory,    Nagoya University   )

    The stationary, quiescent, full-ionized and collision-free Cecium plasma is made by the means of the heat contact ionization in TPC machine.   When the electron cyclotron resonance heating (ECRH) is performed in this plasma by 6 GHz microwave input power of 1 Watt,    the anisotropy of electron temperature up to     is observed by the mirror probe method as shown in Fig.5.


Fig.5 Appearance of anisotropy of the electron temperature
by electron cyclotron resonance heating (ECRH) in Cesium plasma

    However, follow-up experiments tell that the anisotropy of electron temperature is not found for the reason that the microwave power do not become able to penetrate in to the plasma space as experiment goes on and as Cecium atoms are pasted up to a microwave window.
   We regret that the anisotropy may reappear if the microwave window had been refreshed before the follow-up experiment.

4.1.2   Stellerator device (the former Plasma Laboratory, Nagoya University)

    The stationary plasma in Stellerator machine displayed the isotropy of electron temperature in all times as reported in the Annual Review of the former Plasma Laboratory.

4.1.3   TPM device (the former Plasma Laboratory, Nagoya University)

    TPM device is illustrated in Fig.6.   The stationary argon-gas plasma is generated by means of electron cyclotron resonance heating (ECRH) with 2.45GHz microwave power and is confined in the externally applied magnetic mirror field.
   Anisotropy of electron temperature measured by the mirror probe is shown in Fig.7.   As seen in Fig.7, it is shown that the electron temperature is isotropic as .   In this figure, the error bars indicate the indefinite areas caused by the inserted noise in the electron current to the probe.


Fig.6 TPM device


Fig.7 Anisotropy of electron temperature
in stationary plasma

Experimental condition is that the neutral gas
pressure (Argon gas) is p=0.20 mTorr and the
mirror ratios of the externally applied magnetic
mirror field are =2.35 and 3.95 as plotted
by the white and black circles respectively.

4.1.4   TEPSON device (Hatta Lab., Department of Electronic Engineering, Faculty of Engineering,    Tohoku University   )

       TEPSON device    is illustrated in Fig.8.   The stationary argon-gas plasma is generated by means of electron cyclotron resonance heating (ECRH) with 2.45GHz microwave power and is confined in the externally applied magnetic mirror field as like as in the TPM machine.
    Anisotropy of electron temperature measured by the mirror probe is shown in Fig.9.   As seen in Fig.9, it is shown that the electron temperature is almost isotropic as except for the time of TIME=-7.3(ms) when the abrupt increase of plasma density occurs as seen in Fig.8(b).   In Fig.9(c), the error bars indicate the indefinite areas caused by the inserted noise in the electron current to the probe.


Fig.8 TEPSON device


Fig.9 Anisotropy of electron temperature in stationary plasma
Experimental condition is that the neutral gas pressure
(Argon gas) is p=0.45 mTorr and the mirror ratio of the
externally applied magnetic mirror field is =1
(a uniform field of 875 Gauss).

4.2   Unstationary plasma

    However, in after-glow plasma confined in a magnetic mirror field, as a typical unstationary i.e. transient plasma, an anisotropy of distribution function of electron velocity has been observed, and the loss-corn distribution function of electron has been confirmed by the mirror probe method as mentioned below.

4.2.1   TPM device (the former Plasma Laboratory, Nagoya University)

    After the stationary plasma is generated in TPM device, which is taken up in subsection 4.1.3, by pulsed microwave power , the after-glow plasma remains as confirmed as seen in the electron saturation current of the mirror probe as seen in Fig.10.
    The time transience of several plasma parameters is shown in Fig.11 as a reference.


Fig.10 Microwave input pulse and electron saturation current of the probe


Fig.11 The time transience of several plasma parameters
Experimental condition is that the neutral gas pressure
(Argon gas) is p=0.25 mTorr and the mirror ratio of the
externally applied magnetic mirror field is =2.95.

    In Fig.12, two examples of the real data measured by the mirror probe are displayed.   It is because some constant leak current flows in the varying resister, which is used for adjusting the probe bias, that both data are inclined over all.   Nevertheless, this leak current has no influence to a probe characteristics itself as this constant leak current is merely additional to the probe current linearly.

   The several data of the probe current are plotted in Fig.13.   Experimental condition is that the neutral gas pressure (Argon gas) is p=0.20 mTorr, and in (a) and (b), the respective mirror ratios of the externally applied magnetic mirror field are =2.35 and 3.15.   The vertical axis indicate the ratio of the probe electron current at 60 degree of the spot angle to that at 0 degree, and the horizontal axis indicate the normalized probe bias voltage.   The solid curves display the theoretically predicted probe characteristics calculated on the base of a loss-corn distribution function of electrons.

    As seen in Fig.13, the theoretical curves well explain the plotted data.   This means that the distribution function of electrons in the after-glow plasma in TPM device is presumed to be loss-corn distribution function as described below;
       ,                      (24)
where indicates the normalization constant, indicates the mirror ratio of the externally applied magnetic mirror field for confinement of plasma, indicates the plasma space potential at the mirror point measured from the mirror center.
    The velocity space which prescribes the partition of area in regard to the loss-corn distribution is displayed in Fig.14.


Fig.12 Two examples of the real data measured
by the mirror probe

Experimental condition is that the mirror ratio of the
externally applied magnetic mirror field is =2.35,
and in (a) and (b), the respective space potentials at the mirror
point are about two times of and the same with the conversed
value of the electron temperature, the respective neutral gas
pressures (Argon gas) are p=0.12 and 0.20 mTorr and the
respective times after the afterglows start are t=1.6 and 0.8 msec.
Fig.13 The several plotted data of the probe characteristics
Experimental condition is that the neutral gas pressure
(Argon gas) is p=0.20 mTorr, and in (a) and (b),
the respective mirror ratios of the externally applied
magnetic mirror field are =2.35 and 3.15.


    The time transience of anisotropy of electron mean kinetic energy (anisotropy of distribution of electron velocity) in the after-glow is shown in Fig.15(a).   By the way, the factor is means that the dimension of the vertical energy is adapted to that of the horizontal one as has two dimensions in the velocity space while has one dimension.   In this figure, the horizontal axis indicates the time after the after-glow starts.   The numerical value "1" on the vertical axis in this figure indicates the isotropy of kinetic mean energy, and the numerical value over "1" on the vertical axis means that the vertical component of kinetic mean energy is larger then the parallel component.

    Fig.15(a) suggests that the distribution of electron velocity has isotropy at the starting time of the after-glow, but becomes to have anisotropy according as the after-glow plasma flows out of the loss-corn, and finally recovers into isotropy again according with reformation of plasma potential.
    As a reference, in Fig.15(b), the dependency of the anisotropy upon the mirror ratio of externally applied magnetic mirror field is displayed as parameters both of time and neutral gas pressure where the horizontal axis indicates the mirror ratio of externally applied magnetic mirror field.   The solid curves in Fig.15(b) are the theoretical ones calculated on the base of Eq.(24) as a parameter of electric potential at the mirror point of the loss-corn.

    The results mentioned above in TPM machine have been reported in    thesis 1    and    thesis 2   .


Fig.14 The partition of area in regard to the loss-corn
distribution in the velocity space


Fig.15 Appearance of anisotropy in distribution function of electron velocity
of after-glow plasma confined in magnetic mirror field
[reference (1)]

4.2.2   TEPSON device (Hatta Lab., Department of Electronic Engineering, Faculty of Engineering, Tohoku University)

    After the stationary plasma is generated in TEPSON device, which is taken up in subsection 4.1.4, by pulsed microwave power, the after-glow plasma remains as confirmed as seen in the electron saturation current of the mirror probe as seen in Fig.16.
    The time transience of several plasma parameters is shown in Fig.17 as a reference.


Fig.16 Microwave input pulse and ion saturation current of
the probe


Fig.17 The time transience of several plasma parameters
Circles, triangles and squares indicate electron temperature,
floating potential and plasma density respectively.
Experimental condition is that the neutral gas pressure
(Argon gas) is p=0.53 mTorr and the mirror ratio of the
externally applied magnetic mirror field are =3.15.

    Several examples of the real data measured by the mirror probe are displayed in Figs.18 and 19.


Fig.18 A pair of the typical real data measured
by the mirror probe

Experimental condition is that the mirror ratio of the
externally applied magnetic mirror field is =3.15,
the neutral gas pressure (Argon gas) is p=0.53 and
the time after the afterglow starts is t=0.17 msec.


Fig.19 Several examples of the real data measured
by the mirror probe

Experimental condition is that the mirror ratio of the
externally applied magnetic mirror field is =2.95,
the neutral gas pressure (Argon gas) is p=0.25 mTorr and
the time after the afterglow starts is described in the figure.

    The obtained data of the probe current are plotted in Fig.20 as like as in Fig.13.   The vertical axis indicate the ratio of the probe electron current at 60 degree of the spot angle to that at 0 degree, and the horizontal axis indicate the normalized probe bias voltage.   The solid curves display the theoretically predicted probe characteristics calculated on the base of a loss-corn distribution function of electrons which is given by Eq.(24).

    As seen in Fig.20, the theoretical curves do not explain the plotted data.   This means that the distribution function of electrons in the after-glow plasma in TEPSON device is not obeyed to the loss-corn distribution function given by Eq.(24).
    Then, an improved loss-corn distribution function of electron velocity, in which the effects of the electric potentials at both sides of metal plates and the collisional relaxation time of electrons to neutral gas molecules (atoms) are considered, is proposed.   As this distribution function is obtained via the complicated process on the concept shown in Fig.21 and the expression of equation for this function is also too complicated to be described, its detail cannot be written concisely in this thesis.   The detail is reported in thesis for doctorate in 1977   .


Fig.20 The several plotted data of the probe characteristics
The solid curves indicate characteristics calculated with the use
of Eq.(24).   The theoretical curves do not explain the plotted data.
is the probe bias normalized by electron temperature and
is the space potential normalized by electron temperature
at the mirror point of the externally applied magnetic mirror field.


Fig.21 Layouts for deriving "improved loss-corn distribution function"

    The plotted data measured by the mirror probe with each correcting spot angle are compared with the solid curves which are calculated by "improved loss-corn distribution function of electron velocity" in Fig.22 where the horizontal axis represents the probe bias normalized by the electron temperature.   As seen in Fig.22, the theoretical curves well explain the plotted data.   This means that the distribution function of electrons in this after-glow plasma in TEPSON device is presumed to be improved loss-corn distribution function.
   After this, it seems sufficient enough for the angles of the correcting spot of the mirror probe to be chosen as both 60 and 0 degrees of angle.   Three examples of the ratio of two electron probe currents such obtained in the previous description are compared with the solid curves predicted from the improved loss-corn distribution function respectively in Fig.23 where attached to the each curve indicates the space potential normalized by the electron temperature at the mirror point of the externally applied magnetic mirror field.   This may tell not only that the electrons of the after-glow plasma in TEPSON device obey the improved loss-corn distribution function, but also that the measurement of the mirror probe is reliable.

BR>

Fig.22 The measured data of the mirror probe
every spot angle

is the probe bias normalized by the electron
temperature.   Solid curves are the predicted
characteristics obtained from the improved
loss-corn distribution function.   
These curves well explain the measured data.
Experimental condition is that the mirror ratio of the
externally applied magnetic mirror field is =3.15,
the neutral gas pressure (Argon gas) is p=0.30 and
the time after the afterglow starts is t=0.20 msec.
Fig.23 Probe characteristics data
Solid curves are the same as in Fig.21
where is the space potential normalized
by the electron temperature at the mirror point.
Experimental condition is that the mirror ratio of the
externally applied magnetic mirror field is =3.15,
the neutral gas pressure (Argon gas) is p=0.30 and the
time after the afterglow starts is described in the figure.


    The time transience of anisotropy of electron mean kinetic energy (anisotropy of distribution of electron velocity), which is calculated on the base of the "improved loss-corn distribution function", in the after-glow is shown in Figs.24 to 26.   By the way, the factor is means that the dimension of the vertical energy is adapted to that of the horizontal one as has two dimensions in the velocity space while has one dimension.   In these figures, the horizontal axis indicates the time after the after-glow starts.   The numerical value "1" on the vertical axis in these figures indicates the isotropy of kinetic mean energy, and the numerical value over "1" on the vertical axis means that the vertical component of kinetic mean energy is larger then the parallel component.

    These figures suggest that the distribution of electron velocity has isotropy at the starting time of the after-glow, but becomes to have anisotropy according as the after-glow plasma flows out of the loss-corn, and finally recovers into isotropy again according with reformation of plasma potential and with the collisional relaxation.
   In these figures, experimental results are considerably coincide quantitatively and qualitatively to the theoretically calculated curves on the base of the improved loss-corn distribution function.


Fig.24 Time transience of the anisotropy. The solid lines
indicate the theoretical transitions
[reference (4)]
Experimental condition is that the neutral gas pressure
(Argon gas) is p=0.22 mTorr and the mirror ratio of the
externally applied magnetic mirror field is =2.95.
Fig.25 The same as the left [reference (4)]
Experimental condition is that the neutral gas pressure
(Argon gas) is p=0.30 mTorr and the mirror ratio of the
externally applied magnetic mirror field is =3.15.


Fig.26 Tthe same as the left [reference (4)]
Experimental condition is that the neutral gas
pressure (Argon gas) is p=0.46 mTorr and the
mirror ratio of the externally applied magnetic
mirror field is =3.95.

    The results mentioned above in TEPSON machine have been reported in    Annual Meeting of the Physical Society of Japan in 1976   ,    doctorial thesis in 1977    and    Annual Meeting of the Physical Society of Japan in 1975   .

5.    Consideration and discussion

    The anisotropy of electron temperature is almost not found in the stationary plasma by the mirror probe method except for only a little part of the experiment in TPC machine as mentioned in section 4.1.
    The measurement of the mirror probe in the after-glow plasma reveals that the velocity distribution function of electron shows the "loss-corn distribution" in TPM device as seen in Fig.13, or the "improved loss-corn distribution" in TEPSON device as seen in Figs.22 and 23.   At the same time, it may be said that the measurement of the mirror probe is reliable.
    It becomes clear that the distribution of electron velocity has isotropy at the starting time of the after-glow, but becomes to have anisotropy according as the after-glow plasma flows out of the loss-corn, and finally recovers into isotropy again according with reformation of plasma potential and with the collisional relaxation as seen in Figs.15, 24, 25 and 26.
    Judging from the results shown in Figs.15, 24, 25 and 26, it is recognized that the dependency of time transient of the isotropy on neutral gas pressure tends to be as displayed in Fig.27, and that the dependency of time transient of the isotropy on the mirror ratio of externally applied magnetic mirror field for confinement of the plasma tends to be as displayed in Fig.28.


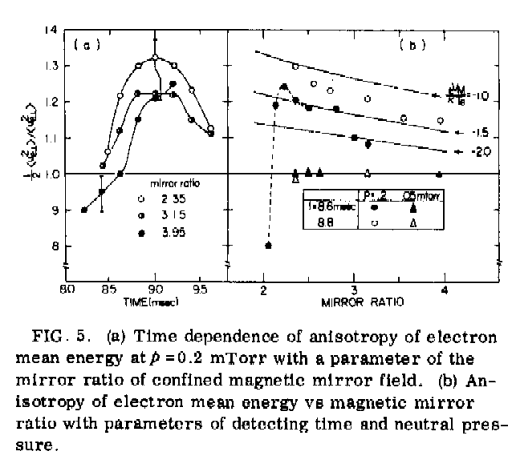
Fig.27 Neutral gas pressure dependency
of time transient of anisotropy
Fig.28 Mirror ratio dependency to time transient
of anisotropy

6.   Conclusion

    The measurement of anisotropy of electron temperature or anisotropy of electron distribution function is performed in both of stationary and after-glow plasmas.
    In most stationary plasma, the anisotropy of electron temperature is not found by the mirror probe method except for only a case in TPC machine as mentioned in section 4.1.
    On the other hand, in the after-glow plasma confined in the magnetic mirror field, the anisotropy of the electron distribution function is observed by the mirror probe method.   This anisotropy is revealed tp be the loss-corn distribution or the improved loss-corn distribution.   Moreover, the transience of the anisotropy is well explained by the theoretically calculated one.
    At the same time, it is recognized that the mirror probe method is available to the determination of the anisotropy of electron distribution function in velocity space.

7.    Problem of this method and caution in the measurement

    The most demerit on this method is the fact that the insertion of this probe in plasma may cause to disturb the environmental plasma and its characteristics as like as in the usual probe.   Moreover, as the size of this probe is larger than the usual one, the influence to the plasma may be more than in the usual one.

    When the parallel macroscopic motion of electrons to the externally applied magnetic field exists, occurrence of the decision failure in regard to the anisotropy of electron temperature should be in mind as seen in Fig.2 and as described in section 3.

    In application of this method, a certain degree of presumption on the electron distribution function is needed, and the obtained data by the probe must be analyzed with the use of the presumed distribution function of electron velocity.   Thus, the mirror probe method has a difficulty to analyze the obtained data as mentioned above.


[Published Theses]

(1)    N. Yamamoto, Y. Hatta, H. Aikawa and H. Ikegami: "Measurement of a mirror probe method of anisotropy of the electron distribution function of afterglow plasma confined in a magnetic mirror field", Physical Review A, Vol.13, No.4, pp.1543-1547 (1978).   

(2)    N. Yamamoto and Y. Hatta: "Magnetic Mirror Probe Method for the Determination of Anisotropy of Electron Temperature in a Magnetized Plasma", Appl. Phys. Letters, Vol.17, No.12, pp.512-514 (1970).   

(3)    N. Yamamoto and Y. Hatta: "Erratum in the above ref.(2)", Appl. Phys. Letters, Vol.20, No.6, p.233 (1972).   

(4)    N. Yamamoto: "Measurement of anisotropy of electron temperature in plasma by mirror probe", Doctoral Dissertation (Tohoku University), Dec. (1977). (in Japanese)   


_ returning to the former page with 'return' of browser _

or

_ returning to the home page with the following button _


HOME

Updated: 2007.5.1, edited by N. Yamamoto.
Revised on Oct. 02, 2009, Feb. 17, 2015, Mar. 16, 2015, Jul. 22, 2016, Dec. 02, 2018, May 02, 2020, May 04, 2020, Jan. 31, 2021, May 09. 2021, Mar. 29, 2022 and May 05,2023.